National Takeaways From 2020 U.S. Census Data: Part Two
Published:
August 18, 2021
Data collected for the 2020 U.S. census can reveal important changes in the size, age, distribution, and ethnic and racial makeup of the population from the national to the neighborhood level. This post takes a deeper dive into some of the larger trends in the national data.
Population trends
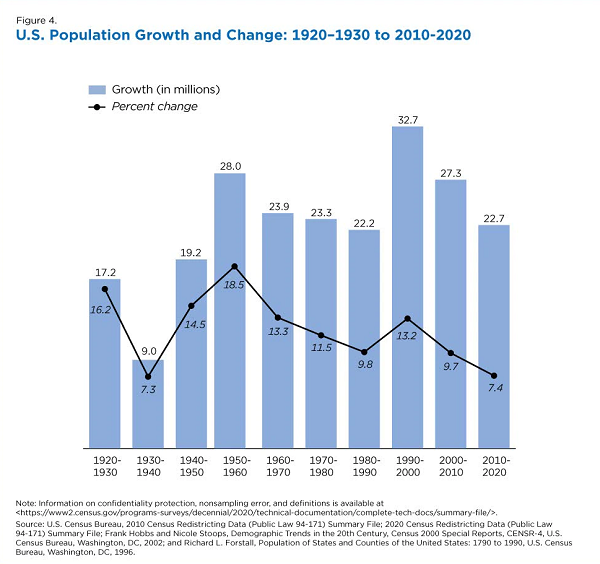
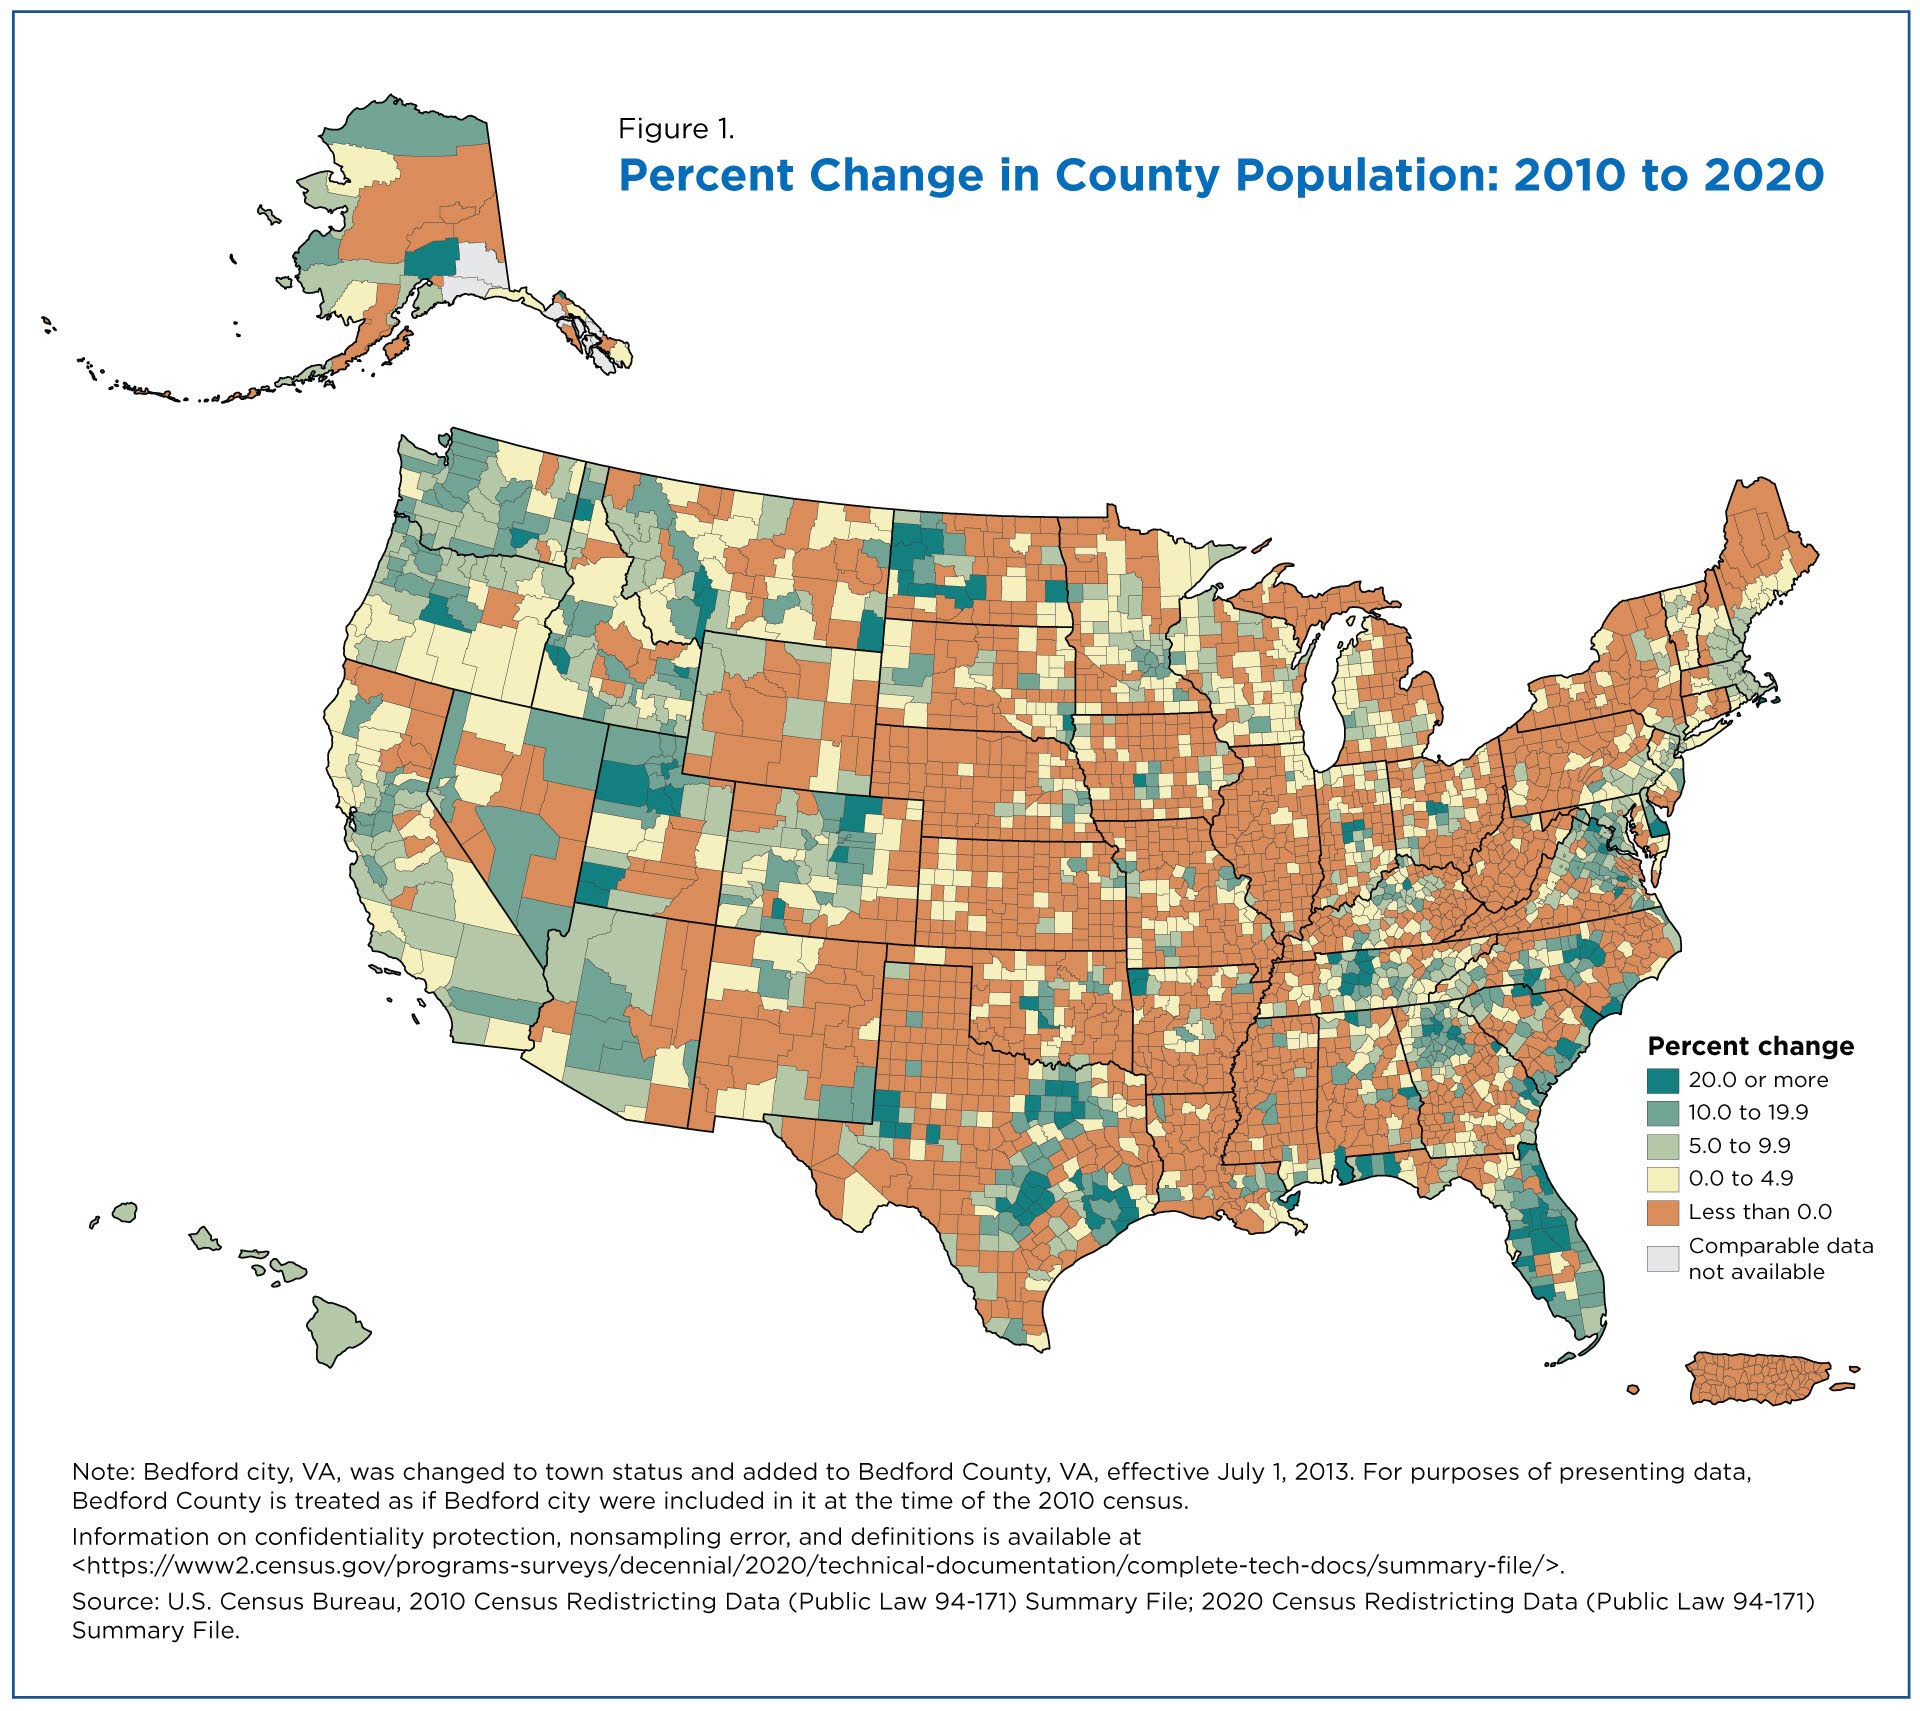
- The 7.4% increase in total population over the last decade was lower than the previous decade’s 9.7% increase and was, in fact, the lowest growth rate since the 1930s (see figure below from the U.S. Census Bureau).
- Thirteen states and the District of Columbia grew by 10% or greater. All are in the West or South regions, with the exception of North Dakota in the Midwest region.
- The populations of three states — West Virginia, Mississippi and Illinois — and Puerto Rico declined over the decade.
- More than half (52%) of the counties in the United States saw their populations decrease from the 2010 Census.

Population distribution trends
- Many counties within metro areas grew over the past decade; 312 of the 384 U.S. metro areas gained population between 2010 and 2020.
- Counties in these metropolitan or micropolitan areas, also known as Core Based Statistical Areas (CBSAs), showed increases that averaged 3.8%, while counties outside of CBSAs declined on average by 3.9%.
- Suburban areas continue to have some of the highest percentage growth rates in the nation.
Age trends
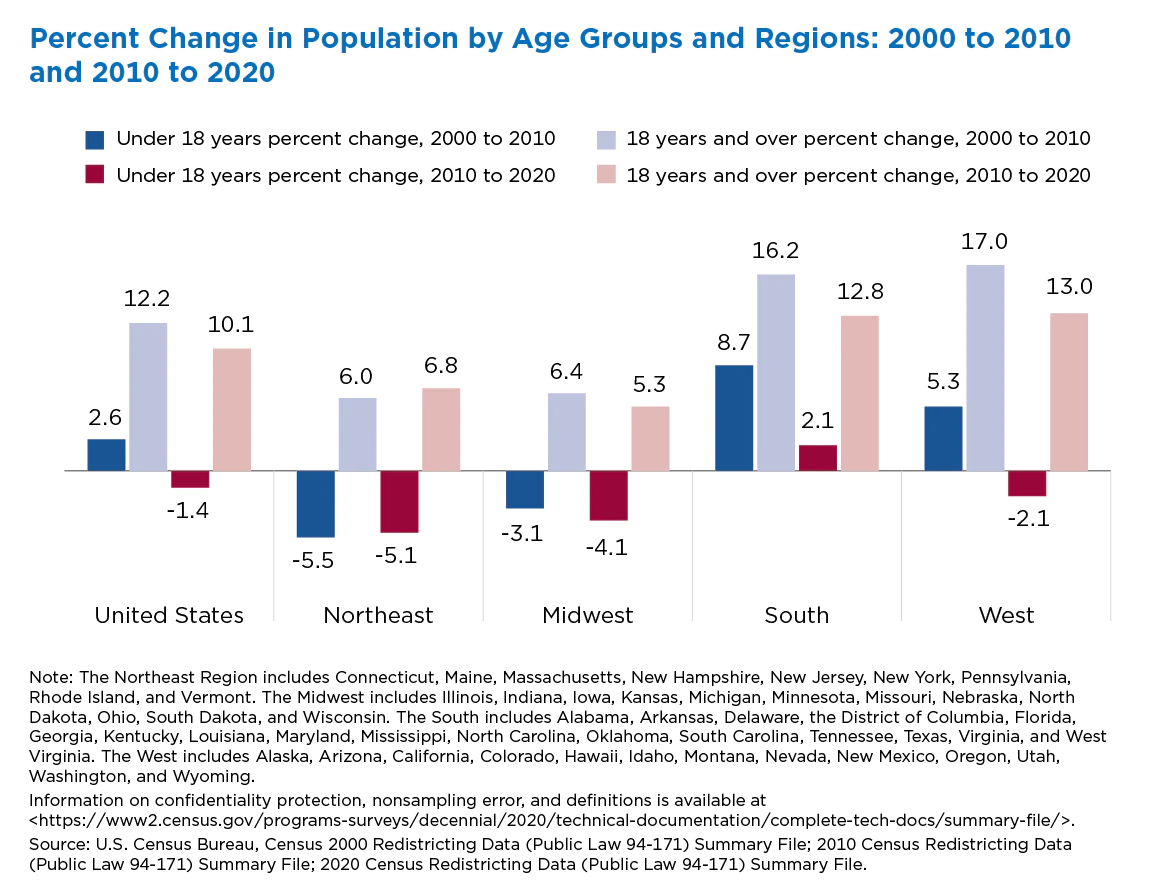
- The population is ageing: 77.9% of the population is over the age of 18, a 2% increase from 2010.
- This adult population has been increasing faster than the under-age-18 population.
- The Northeast had the largest proportion of adult population (79.7%) and the smallest proportion of people under age 18 (20.3%). In contrast, the South had the lowest proportion of adult population (77.5%) and the highest proportion of young population (22.5%).
Race and ethnicity trends
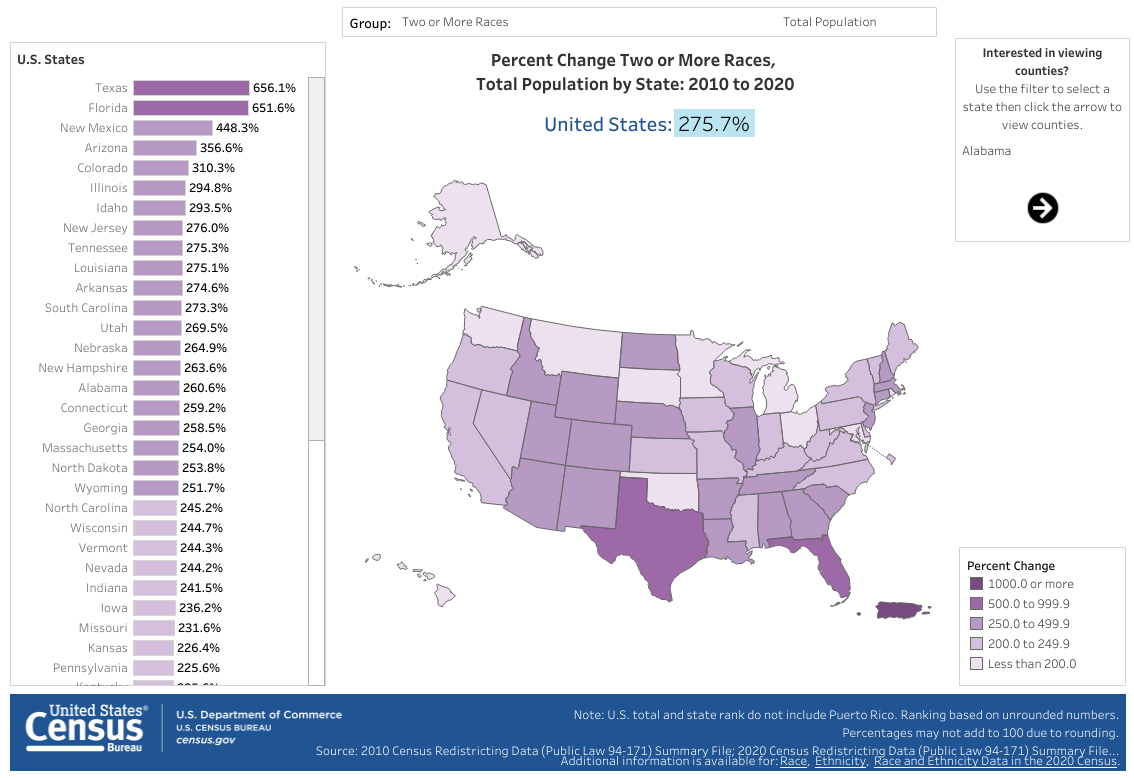
- Nearly all groups saw population gains this decade and the increase in those identifying as two or more races was especially large (up 276%). Those identifying as White alone declined by 8.6% since 2010.
- Those identifying as Hispanic or Latino population make up 18.7% of the population, up from 16.3% in 2010, a 23% increase from 2010. Those identifying as African American or Black decreased slightly, from 12.6% of the total population in 2010 to 12.4% of the population in 2020. Note that the Census Bureau has changed how ethnicity is measured, so comparisons, especially concerning the Hispanic or Latino population, should be treated with caution.
Racial and ethnic diversity index
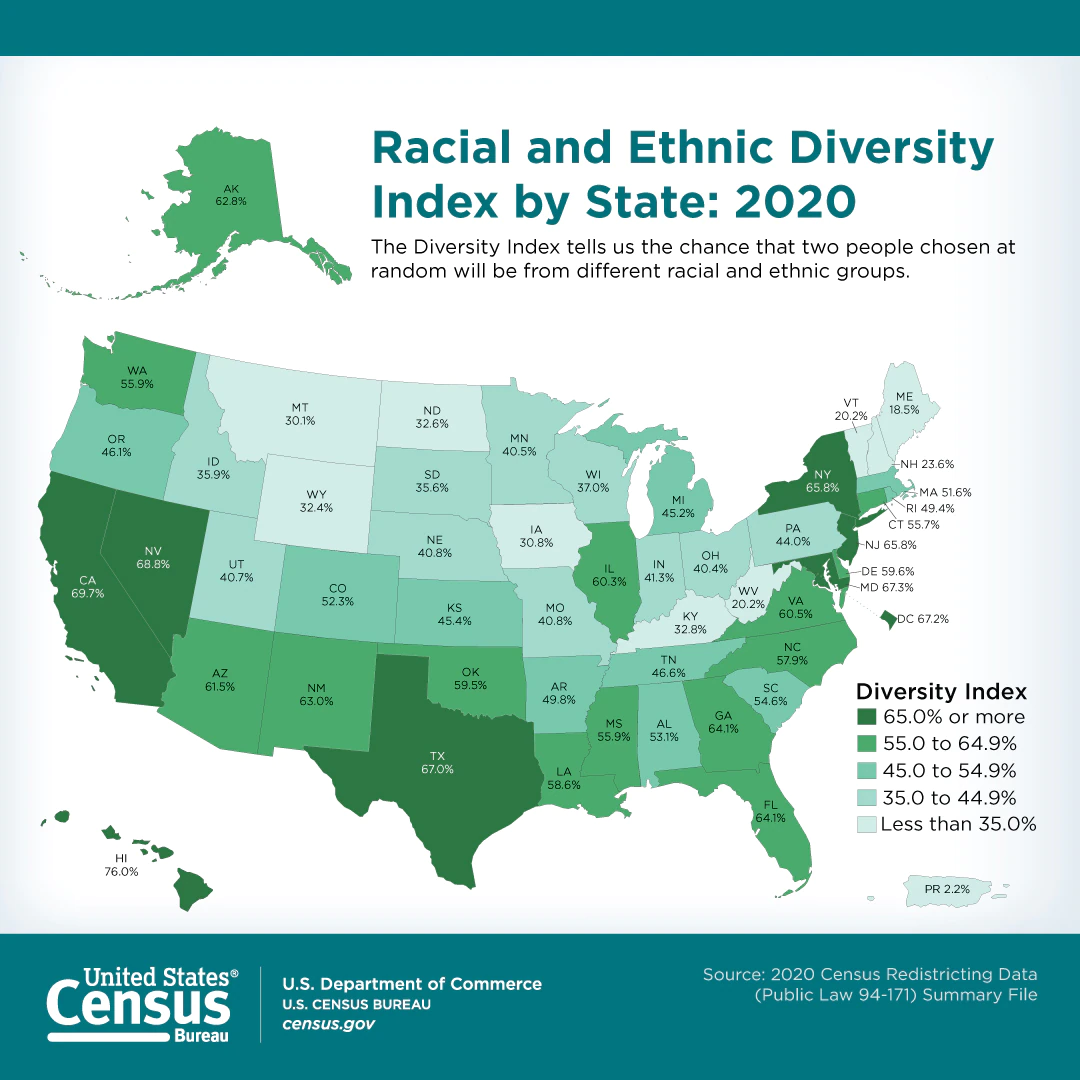
The U.S. population is much more multiracial and more diverse than what the Census measured in the past. For this Census, the bureau has developed a Diversity Index, which attempts to measure the racial diversity of a given population. It is based on the probability that any two people chosen at random from the population would be from different races. Using this index, Hawaii was ranked as the most diverse, with an index value of 76%, while Maine was the least diverse, at 18.5%.
Resources from the Census Bureau
-
August 18, 2021
Population Under Age 18 Declined Last Decade -
August 18, 2021
2020 Census Demographic Data Map Viewer